


Lumber is becoming an increasingly expensive commodity. Pressure from environmental concerns as well as processing costs demand that lumber manufacturing be done in the most efficient way, getting the maximum amount of quality product from every tree that enters the mill. Nature, however, does not make this an easy task, with every tree being different in terms of size, shape, and quality.
The proven solution to these challenges in wood optimization is to employ 3D laser and color scanning. Laser and colour scanning provide dramatic improvements in yield and quality in all areas of lumber manufacturing.
Log Optimization (Primary Process)
The first operation in a mill is cutting logs into semi-finished boards (flitches). These operations can occur at up to 30 logs per minute, requiring a large amount of data to be collected and analyzed in a short time. The scanner configuration implemented for 3D log scanning depends on the layout of the log transport system.
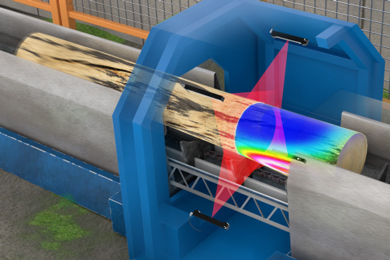
When logs travel on a sharp chain into the mill, the common scanner configuration mounts 3, 4, or more laser line scanner heads in a ring layout spaced to provide full coverage. As the log moves through the scan plane, a full 3D map of the log surface is generated. Cutting patterns are then computed and sent to a downstream gang saw that strips away the outer flitches and a center cant.
Logs can also be loaded onto a headrig carriage—a kind of moving platform that positions, rotates, and transports the log through a single bandsaw. In this design, multi-line laser scanner heads are mounted along one or two sides of the carriage along the entire log length such that a single capture produces profile data every 6″. This snapshot data can immediately be used to make decisions on the next cut for the current opening face.
The cutting decisions are an accumulation of multiple scans and back and forth passes through the bandsaw until the final cant is dumped for downstream processing.
Board Optimization (Secondary Process)
After logs have been reduced to flitches and cants, secondary operations are required to edge pieces for width and to trim to length at two different machine centres—an edger and a trimmer optimizer.
In both machine centres, transverse 3D scanning is introduced to digitize each piece into 3D shape, 2D surface colour, and tracheid data. This information is then used to determine the best cutting patterns that yield maximum value based on a constantly changing demand for certain dimensions and grades.
Transverse conveyor systems use multi-point scanners (with the highest available data rate of 3000 scans per second using coplanar triangulation for excellent data quality). Speed of data acquisition is very important for secondary operations where part rates of 70 to 300 boards per minute are common.
Modular Board Scanning Systems for Finished Grading
With the Gocator® 200 series multi-point scanners, a modular board scanning system can now be designed mixing 3D profiles, tracheid, and colour. Colour, for example, may be used only on the wane-up surface, while profile and tracheid is used on both top and bottom board surfaces.
Multi-Point Scanning for Tracheid
In addition to multi-point scanners minimizing scanner frame space and seeing both edges of a board, these scanners achieve another critical capability—the measurement of tracheid effect.
When a laser spot is projected onto healthy tracheid wood cells, laser light is scattered into the cells in the direction of cell growth. If the wood fibre is dead (as in a knot), then the laser light does not scatter. This effect can be measured to identify good wood from defective wood and even determine grain angle.
Adding Color Vision for Defect Detection
The introduction of colour scanning to identify surface defects such as knots, splits, rot, speck, beetle damage, etc., has led to grade-based recovery optimization, where lumber is cut into boards to obtain the highest grade as opposed to extracting the highest volume. Higher grade output leads to higher dollar returns from the input wood fibre.
Colour scanning requires the addition of white light to illuminate the board surface and megapixel colour cameras to build high resolution colour images. Resolutions down to 0.25mm are typical in today’s high performance colour scanners.
The bolt-on Gocator® 205 vision module (along with a white LED light bar that is strobed to maximize efficiency and lifetime) provides Gocator® 200 scanners with color vision for detection and measurement of surface defects including knots, splits, and rot. Gocator® 200 scanners also have the ability to identify defect size and location, which is key in effective grade-based recovery optimization.
Lumber Optimization with Gocator®
The Gocator® smart sensor feature set offers onboard processing to configure triggering, exposure, resolution, board detection, filtering, stitching, measurement, builtin communication protocols to other factory equipment using Ether/IP, and advanced
visualization. With an open source SDK, customers can build sophisticated scanning solutions and deliver unique capabilities that are specific to mill requirements.
For more information on 3D scanning for wood optimization applications, visit LMI wood industry page at http://www.lmi3d.com/solutions/industries/wood
Photo: Ring layout of Gocator® 2880 laser line scanners scanning a log travelling along a lineal transport system.